
The double top pattern is one of the most recognized and reliable bearish reversal signals in technical analysis. It forms after a strong bullish trend and signals a possible trend reversal when the price fails to break above a key resistance level twice.
Traders often rely on this pattern to identify weakening momentum and prepare for a potential downward shift. What makes the double top pattern so powerful is its ability to highlight a shift in market sentiment—a clear warning that buyers are losing control and sellers may soon take over. For those involved in forex trading or stock markets, mastering this pattern can lead to smarter, more confident trading decisions.
What Is a Double Top Pattern?

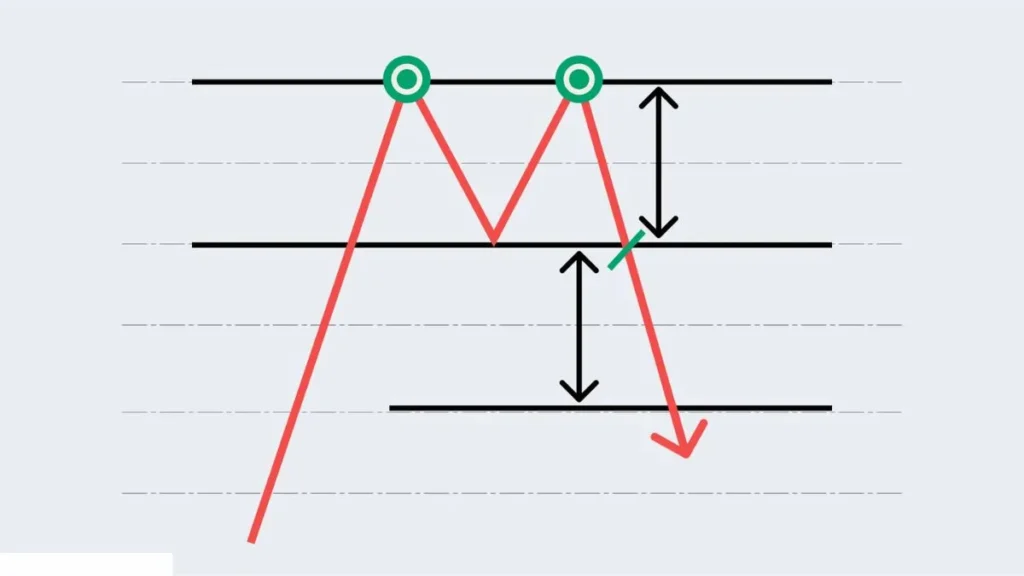
A Double Top Pattern is a bearish reversal pattern that forms after a strong bullish trend. It looks like the letter “M” on the chart. The price climbs to a high (peak), pulls back to a support level (trough), climbs again to the same high, and then falls again. This second fall confirms the shift in market sentiment.
The pattern becomes valid when the price breaks the neckline support. This is the line that connects the lows between the two tops. The break below the neckline shows the bearish reversal signal and confirms that sellers are now in control.
How to Identify a Double Top on a Chart
To spot a Double Top Pattern, look for two price peaks that reach similar levels. Between these peaks, the price should fall to a support level (the neckline). After the second peak, if the price breaks below this neckline, you have your confirmation of the pattern.
Use volume and other forex trend reversal indicators like RSI or MACD to strengthen your analysis. Volume often decreases on the second peak, showing weaker buying pressure. This gives a clue that the trend reversal is near. Use candlestick patterns to support your decision.
Double Top vs. Double Bottom: Key Differences
The difference between a double top and a double bottom is simple. A double top forms at the end of an uptrend, signaling a market reversal to the downside. A double bottom pattern forms at the end of a downtrend and signals an upward reversal.

The double top looks like an “M,” while a double bottom looks like a “W.” Both use a neckline support for pattern confirmation. However, a double top signals a short position, and a double bottom hints at a long position.
| Feature | Double Top | Double Bottom |
| Shape | M | W |
| Trend Direction | Ends Uptrend | Ends Downtrend |
| Signal | Sell | Buy |
| Position | Short | Long |
What Does the Double Top Tell You About the Market?
The Double Top Pattern tells you that the buying power is weakening. The market tried to rise twice but failed both times. This forms a bearish reversal signal. Sellers gain control after the price fails to break the resistance level twice.
This also shows a clear shift in market sentiment. Buyers no longer have confidence. If the price breaks the neckline support, it confirms the pattern and signals a strong chance of a trend reversal.
Best Indicators to Use With a Double Top
To confirm a Double Top Pattern, use technical tools like RSI, MACD, and volume. These indicators help you confirm if the momentum is fading.
A falling RSI or bearish MACD crossover strengthens the confirmation of pattern.
Combine this with candlestick patterns and trendlines. Watch for false breakouts that can trap early traders. Patience pays here—wait for the right entry point in a double top trade.
How to Trade the Double Top Pattern
First, wait for the price to break the neckline support. This is your confirmation of the pattern. Once the price closes below this line, you can enter a short position. Place your stop-loss order just above the second top to limit your risk.
Set your take-profit level based on the height from the peak to the neckline. Use a trailing stop if you want to lock in profits as the price continues to fall. These steps help improve your risk management in every trade.
Real Examples of Double Top in Forex and Stock Charts
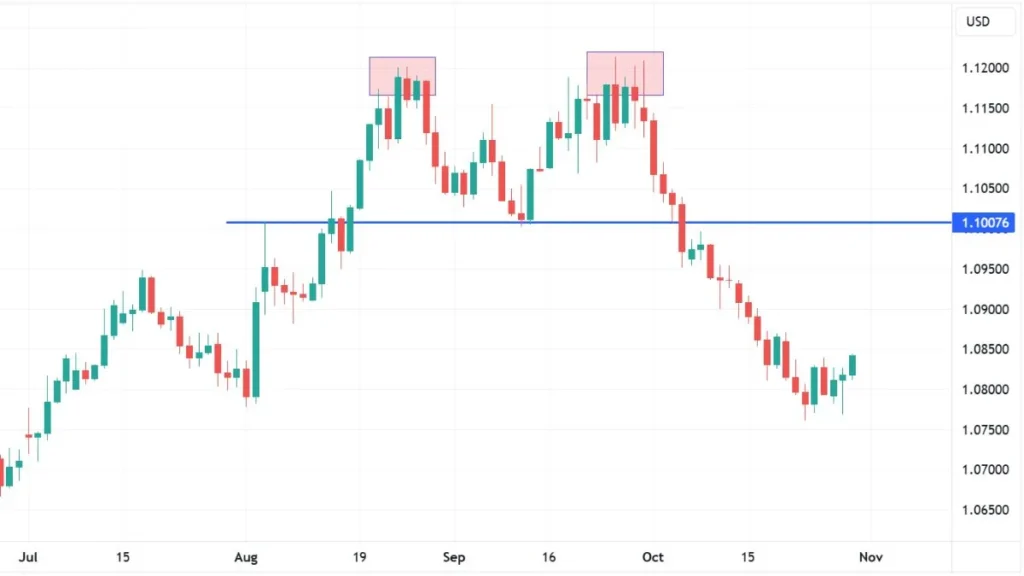
Let’s look at a forex trading example using EUR/USD. In July 2022, EUR/USD formed a clear Double Top Pattern near 1.0800.

After failing to break the resistance level twice, it dropped sharply below 1.0600, confirming the pattern.
In the stock market, Apple (AAPL) showed a double top forex setup in 2021. The price hit $157 twice before reversing to $140. The neckline break gave traders a clear entry and exit point with a well-defined stop loss and take profit in forex style.
Common Mistakes to Avoid When Trading Double Tops
One big mistake is jumping in before the neckline support breaks. This can lead to losses if it turns into a false breakout. Another mistake is ignoring volume signals. If the volume doesn’t drop on the second peak, the pattern may not be valid.

Traders often forget to use stop-loss orders or set poor take-profit levels. Others risk too much on one trade. Strong risk management keeps you safe even if the setup fails. Always wait for the proper pattern confirmation.
Advantages and Disadvantages of the Double Top Pattern
The Double Top Pattern is simple and works across all timeframes. It offers clear entry and exit points, making it perfect for beginners. It’s also easy to confirm with technical analysis tools and price action.
But the pattern has downsides. It can form false breakouts. It may fail in strong bullish trends or low-volume markets. You must always use forex trend reversal indicators and stay cautious when the setup isn’t clear.
Bonus: Pro Tips to Master the Double Top Strategy
Practice is key. Use demo accounts to test the Double Top Forex setup. Keep a trade journal. Note your entry and exit points, what indicators you used, and how well you followed your plan.
Review your wins and losses.
Focus on trading the neckline break. Wait for a candle to close below the line. Combine this pattern with major currency pairs (e.g., EUR/USD) during high-volume sessions like the New York open. Over time, you’ll master trading forex with patterns like this.
Conclusion
Understanding the double top pattern gives traders a powerful edge when spotting bearish reversal signals. It clearly shows a shift in market sentiment, warning that an uptrend may be ending. By learning how to identify a double top pattern and using proper technical analysis, traders can avoid common mistakes and improve their entry and exit points.

Whether you trade stocks, forex, or crypto, mastering the double top forex setup helps you recognize trend reversal signals early. Combine this pattern with smart risk management, clear stop-loss, and take-profit in forex, and you’ll have a reliable strategy. Remember, always confirm the pattern, wait for the neckline break, and use tools like candlestick patterns and trend confirmation indicators for better results. With practice and discipline, trading the double top pattern can become a key part of your winning game plan.
FAQs
Q: Is the double top pattern bullish?
A: No, the double top pattern is a bearish reversal signal that suggests a potential price decline after an uptrend.
Q: What is the rule for the double top pattern?
A: The key rule is that price must form two peaks at the same resistance level, followed by a neckline support break.
Q: What happened after the double top pattern?
A: After confirmation, prices typically fall, signaling a trend reversal and a good spot for a short position.
Q: What is the double top pattern called?
A: It’s often called an “M pattern” because of its shape on the chart.
Q: What is the zigzag stripe pattern called?
A: The zigzag stripe pattern in design is called a “Chevron” pattern.